

Will there be enough time? The burndown answers today.
Burndown is a view on the task screen itself, next to the list, board, calendar and Gantt. Apply a filter and the chart shows how much is left, day by day, compared with the pace that finishes on time.
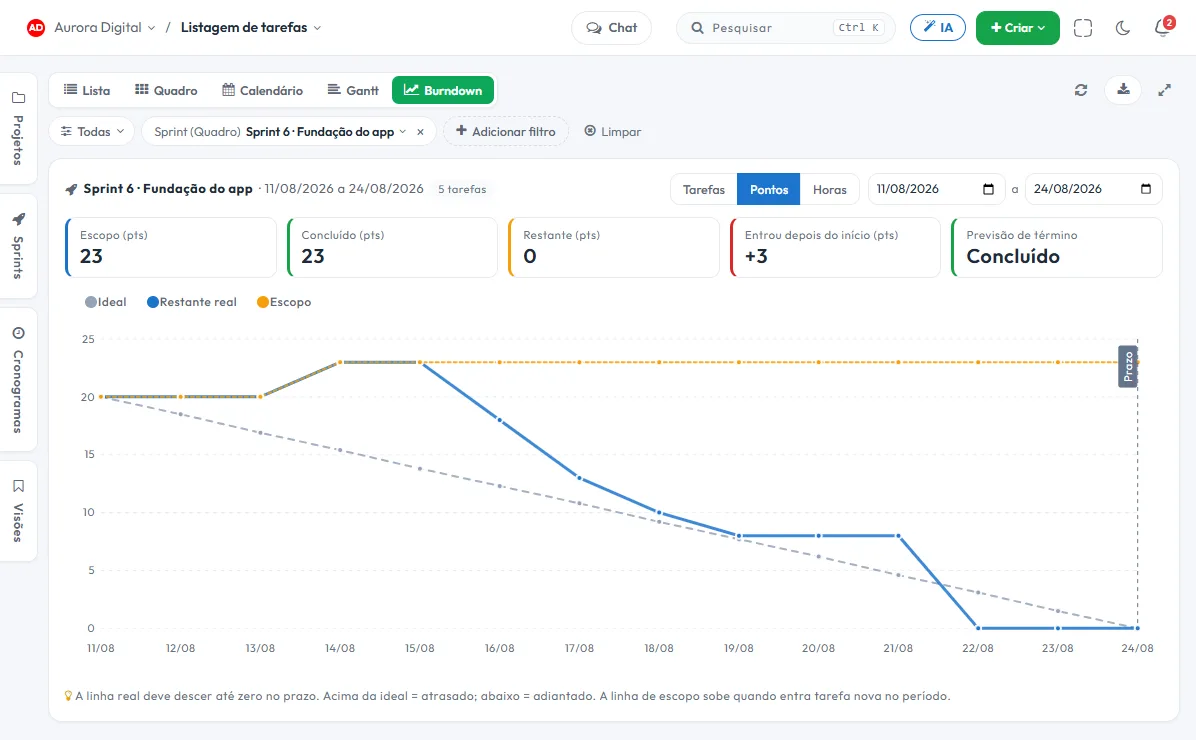
The chart that warns you mid-cycle, not the day before
The question in the check-in meeting is always the same: at today's pace, will the delivery close? The burndown answers with a line, and Tasskee puts the number next to it.
From any filter
Sprint, project, client, assignee, tag or saved view. The chart uses the same tasks the list is showing.
Tasks, points or hours
Count items, sum effort points or time estimates. In points, subtasks don't add up, so the scope isn't counted twice.
The scope that came in
A dedicated line shows when new work arrived, and the "Added after start" indicator explains the cycle that didn't close.
Expected completion
From the period's completion pace, Tasskee projects the date when the remainder reaches zero and flags it in red when it goes past the deadline.
Filter a sprint and the chart becomes its burndown
With a sprint in the filter, the period is the cycle's and, in points, the ideal line starts from what was committed at the beginning. Without a sprint, the period runs from the first start to the last due date of the tasks, and you can choose another.
- Ideal line, actual remaining and scope, with the Due date and Today markers
- Past the deadline with open work, the chart stretches to today to show the overrun
- Scope, completed, remaining and projected finish always in view
- The saved view keeps the Burndown together with its filters
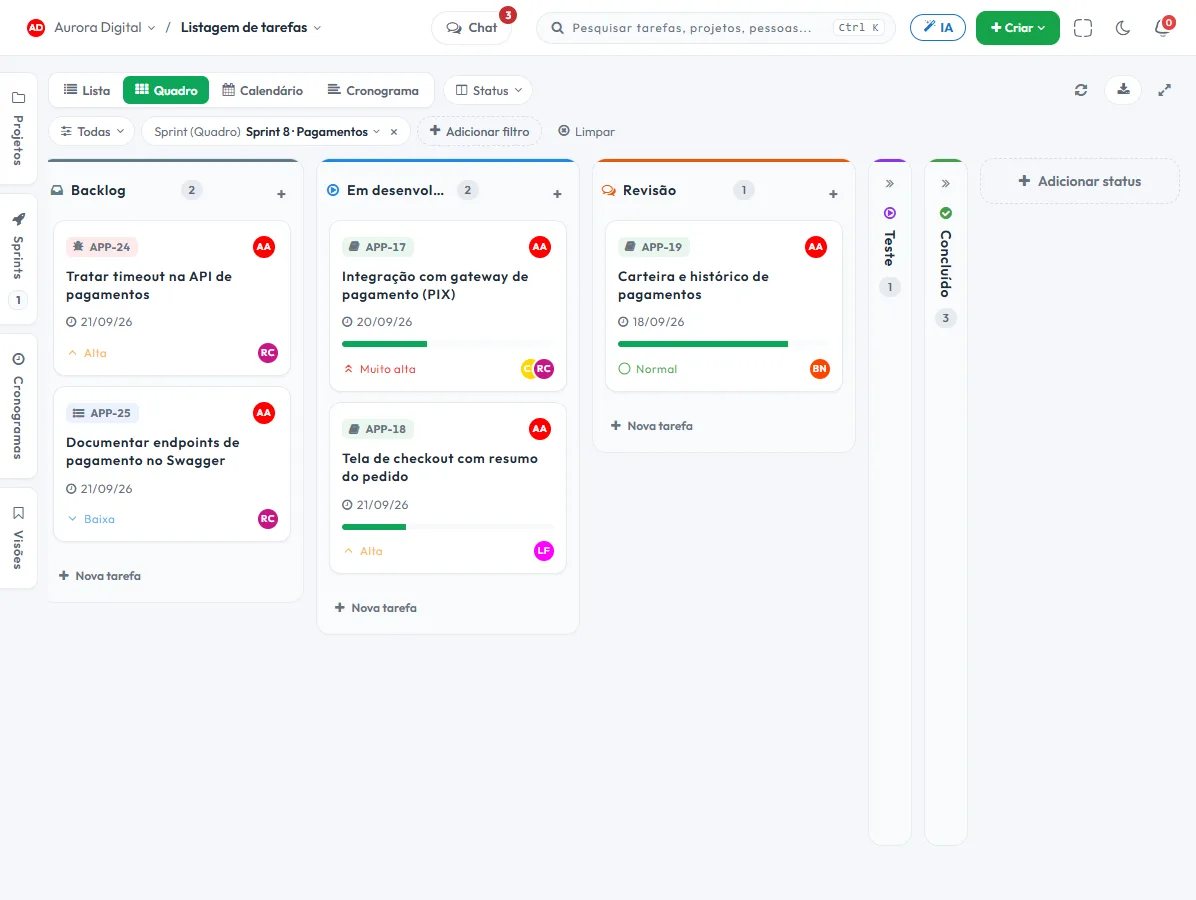
This lives alongside the rest of the operation
Task, schedule, ticket, goal, and conversation are the same database. What changes in one place shows up in the other, with nothing to export.
How to read a burndown chart and act before the deadline
The burndown is the simplest chart in agile management: days run along the bottom axis, and the work still remaining runs up the side. An ideal line falls straight to zero by the deadline, and the actual line shows what really happened. The distance between the two answers the question every manager asks mid-cycle: will we make it?
In Tasskee the burndown isn't a separate report. It's a view of the tasks screen, next to the list, the board, the calendar and the Gantt. The chart uses exactly the tasks the filter is showing, so it works for a sprint, a client, one person's workload or a whole project.
Step by step
- Filter what you want to track. Pick the sprint in the side panel, or build the filter by project, assignee, tag or client. A saved view works too.
- Click Burndown. With a single sprint in the filter, the period is the cycle's. Without a sprint, it runs from the earliest start to the latest due date of the filtered tasks. The dates at the top of the chart let you choose another period.
- Choose the unit. Tasks counts items and works with no setup at all. Points adds up the effort estimated by the team. Hours adds up the time estimate. If any task has no points or no estimate, the screen tells you how many were left out of the calculation.
- Compare the actual line with the ideal. Above the ideal, the team is behind; below, ahead. What matters is the trend of the last few days, not a single point.
- Look at the indicators on the side. Scope, completed, remaining, how much came in after the start, and the finish forecast based on the current pace. The forecast turns red when it goes past the deadline.
- Decide early. If the forecast is already past the deadline mid-cycle, you can still cut scope, redistribute tasks or renegotiate the date. On the eve, all you can do is apologize.
The shapes the chart usually takes
| What you see | What it usually means | What to do |
|---|---|---|
| Actual line hugging the ideal | The pace is in line with the plan | Keep going, and use the cycle as a velocity reference |
| Plateau lasting several days | Nothing is being completed: a task that's too big or a stalled review queue | Break the task into smaller pieces or look at the time in status |
| Sharp drop only at the end | Tasks are closed in batches, not when they finish | Agree to move the card on the day the work ends |
| Line going up | New work came in during the period | Check the scope line and the "Added after start" indicator |
| Below the ideal from the start | The team pulled in less than it could, or padded its estimates | Use the real velocity in the next planning |
Scope that arrives mid-cycle
Almost every cycle that doesn't close has the same story: the team worked at the agreed pace, but new requests arrived along the way. In an ordinary burndown that shows up only as a line that doesn't go down. In Tasskee, the scope line goes up on the day the work came in, and the indicator shows how much it was. In points, when the sprint has its commitment recorded at the start, the ideal line starts from that commitment, not from today's scope. That way yesterday's chart doesn't change just because someone added a task today.
A campaign with 40 deliverables, a client onboarding, a construction handover: anything with a set of tasks and a deadline fits the chart.
See how sprints workBest practices
- Complete the task on the day it finishes. The chart reads the completion date. Closing everything on Friday produces a staircase, not a picture of the pace.
- Prefer small tasks. A two-week task leaves the chart flat for two weeks and hides whether it's moving.
- Pick one unit and stick with it. Points and hours say more than a count, but only if the team always estimates. Count is the most honest when estimating isn't a habit yet.
- Save the view. The client's or the current sprint's burndown becomes one click in the side panel.
Common mistakes
- Reading the chart of a single day. One bad day isn't a trend.
- Comparing teams by their burndown. Each team estimates differently; compare a team with itself.
- Hiding new scope to make the chart look good. The line that goes up is the most useful information in the meeting.
- Using the burndown to hold individuals accountable. It shows the pace of the group, and the conversation should be about the group.
Where the burndown fits
The Burndown view is on the Pro plan, along with the advanced reports, which include the Sprint Burndown, cycle velocity and the closing report. To plan the cycle, see how sprints and the Scrum guide work. For the long-range deadline, with dependencies between tasks, use the Gantt schedule. Try Pro for 15 days, no card required, and open the burndown for your next delivery.
Questions about burndown
What is a burndown chart?
Do I need to work in sprints to use it?
Why does the line sometimes go up?
Measure by tasks, points or hours?
Does it work on the tickets screen?
Know today whether delivery will close on time
Create an account, try Pro for 15 days and open the burndown of your next sprint.