

Find out where work gets stuck, with the number alongside.
Every team suspects where the process jams. The Flow dashboard reads each task's history and turns the suspicion into days: how much time is lost at each stage, and what it would cost to cut that in half.
The data most tools throw away
Measuring where work gets stuck requires keeping every status change, with date and author. Without that history, the most you know is where the task is now — never where it has been.
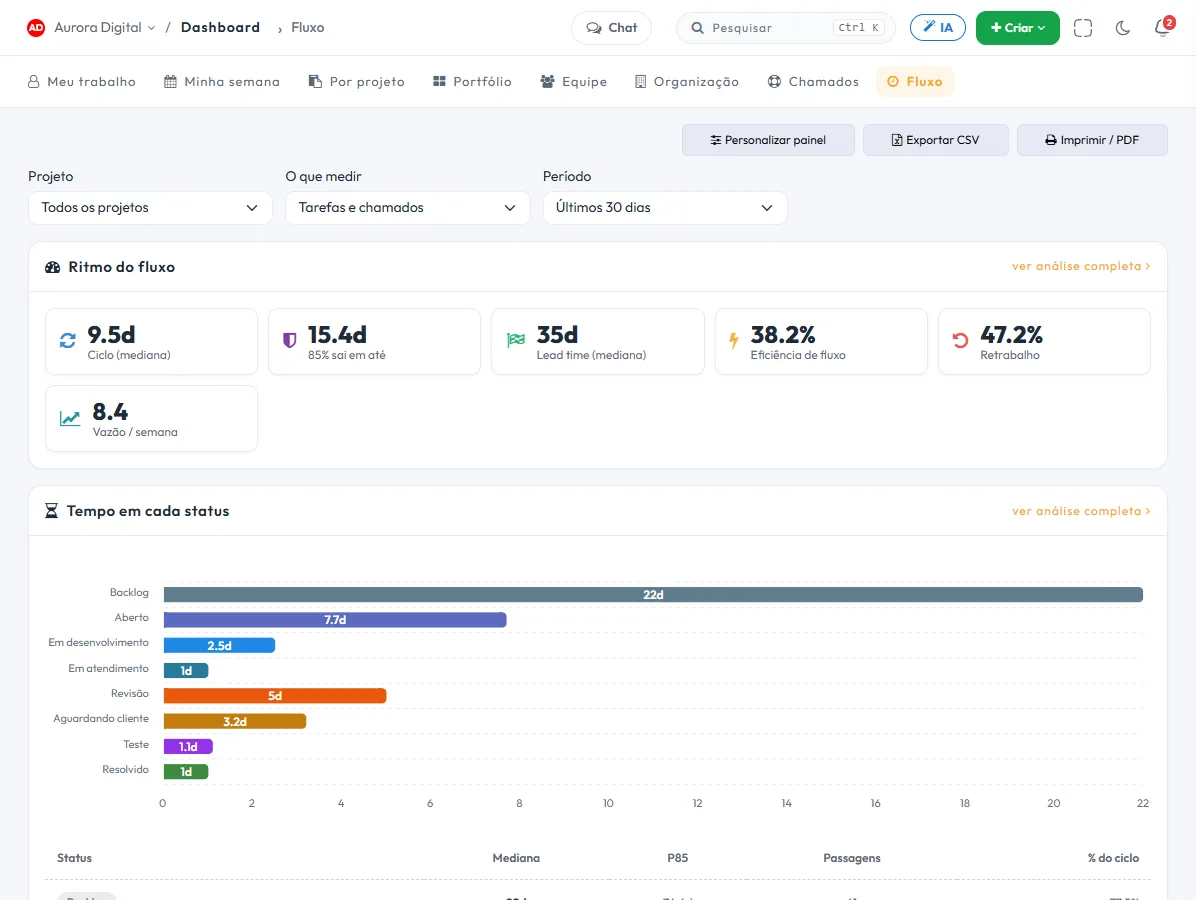
Time in each status
Median and P85 per stage, counting each pass. A task that went back to review three times counts three times, as it should.
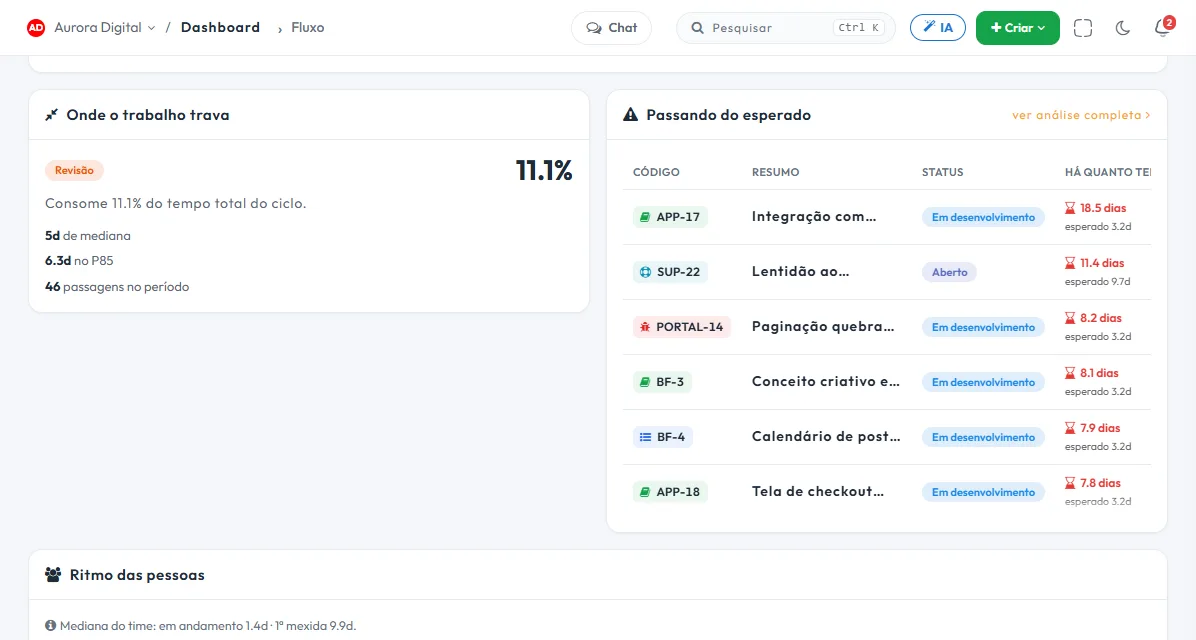
The bottleneck, with a name and a cost
Instead of one more chart for you to interpret, a ready-made sentence: which stage consumes how much of the cycle, and in how many passes.
Flow efficiency
How much of the time was work and how much was waiting. It comes straight from your statuses, with nothing to configure.
What is about to blow up
Open tasks compared with the normal time of their own stage — not with a fixed deadline that is the same for all.
Numbers that hold up in the meeting
A task forgotten for two years shifts any average and hides the team's real behavior. That is why the dashboard uses median and percentile — and says when the sample is too small to conclude anything.
- P85: "85% of tasks leave this stage within X days," the number you can promise
- A small sample is flagged instead of being turned into a conclusion
- With no data, the screen shows "—" instead of zero
- Tasks and tickets on the same dashboard, together or separate
This lives alongside the rest of the operation
Task, schedule, ticket, goal, and conversation are the same database. What changes in one place shows up in the other, with nothing to export.
How to use time in status to find the bottleneck in your process
Almost every team has a hunch about where work gets stuck. The review, the client's approval, the technician's queue. The Flow dashboard swaps the hunch for days: how long each task spends in each status, counting every pass. Here's how to use it without getting lost in the charts.
Step by step
- Make sure the board reflects reality. The dashboard reads the history generated when someone moves a task between statuses. If the team only drags the card to "Done" at the end, the dashboard has nothing to measure. Use statuses that describe the real stages.
- Open the dashboard and read the bottleneck sentence. Instead of yet another chart, it tells you which stage consumes how much of the cycle, and in how many passes.
- Look at the median and the P85 per stage. The median is the typical time. The P85 is the number you can promise: 85% of tasks leave the stage within X days.
- Check flow efficiency. It's the share of time the task was being worked on, rather than waiting. Tasskee calculates it automatically based on which statuses are work and which are waiting.
- See what's about to blow up. Open tasks are compared with the normal time of their own stage, not with a one-size-fits-all deadline. Whatever is out of the ordinary shows up before it becomes overdue.
- Pick one bottleneck and tackle one at a time. Change one rule, like a card limit in review or a fixed approval time, and watch the number in the next cycle.
How to read the dashboard
| Indicator | What it tells you | What to do |
|---|---|---|
| Median per stage | The typical time a task spends there | Compare stages with each other |
| P85 | The time 85% of tasks stay within | Use it to promise a deadline to the client |
| Passes | How many times the task entered the stage | Many passes in "Review" suggest rework |
| Flow efficiency | Work versus waiting | Attack the waiting, which is usually the biggest share |
| Small sample (flagged) | Too little data to conclude | Wait for more tasks before deciding |
Where there's no data, the screen shows "—" instead of zero, so nobody confuses missing history with zero time.
Examples by type of company
Marketing agency in São Paulo
The dashboard shows that deliverables spend more time in "Client approval" than in "Creative". The bottleneck isn't the creative team. The agency starts sending approvals with an agreed deadline in the client portal and tracks that stage's median week by week.
Managed IT support company in Curitiba
Tasks and tickets live in the same flow, and the dashboard measures both, together or separately via the filter. The "Waiting for part" stage concentrates the waiting. The team starts ordering the part on the same day they diagnose. See also tickets with deadlines.
Engineering firm in Joinville
Technical review shows up with several passes per task. The owner realizes the initial briefing is incomplete and starts validating the scope before starting, which reduces the back-and-forth.
Best practices
- Few statuses, with clear meaning. Twelve columns dilute the measurement. Define what is work and what is waiting.
- Promise by the P85, not the average. A task forgotten for months shifts any average and hides the team's real behavior.
- Discuss process, not people. The dashboard shows stages, and the conversation should stay with the stage.
- Review after making changes. Changed a rule? Measure in the next cycle before concluding.
Common mistakes
- Drawing conclusions from a small sample. The dashboard warns you, but heed the warning.
- Expecting history from before the account started keeping the change log. The dashboard shows the start date and doesn't pretend to cover what doesn't exist.
- Moving cards in batches at the end of the month. That measures the habit of updating, not the process.
- Trying to zero out the waiting. Some waiting time is natural. The target is to cut the kind that adds nothing.
Plan and history
The Flow dashboard is on the Pro plan, because it depends on the change history, which Pro keeps for 90 days and Max without limit. To dig deeper into the concept, read time in status: where work gets stuck, and for the board method behind the dashboard, the Kanban guide.
The dashboard is part of the set of reports and dashboards, and works best with a well-maintained Kanban board. Try Pro for 15 days, no card required, and find out in days what today is just a feeling.
Questions about time in status
Do I need to configure anything?
Does it work for tickets too?
What is flow efficiency?
Can I see the history from before I signed?
Stop arguing about where the process gets stuck
Try Pro for 15 days and see, in days, what today is only a hunch.