

The week's status report, ready before coffee.
Choose the template, the projects and the period. Tasskee takes a snapshot of that day's indicators, the AI writes the sections from the numbers, and you review, edit and export the PDF. No pasting dashboard screenshots into PowerPoint every Friday.
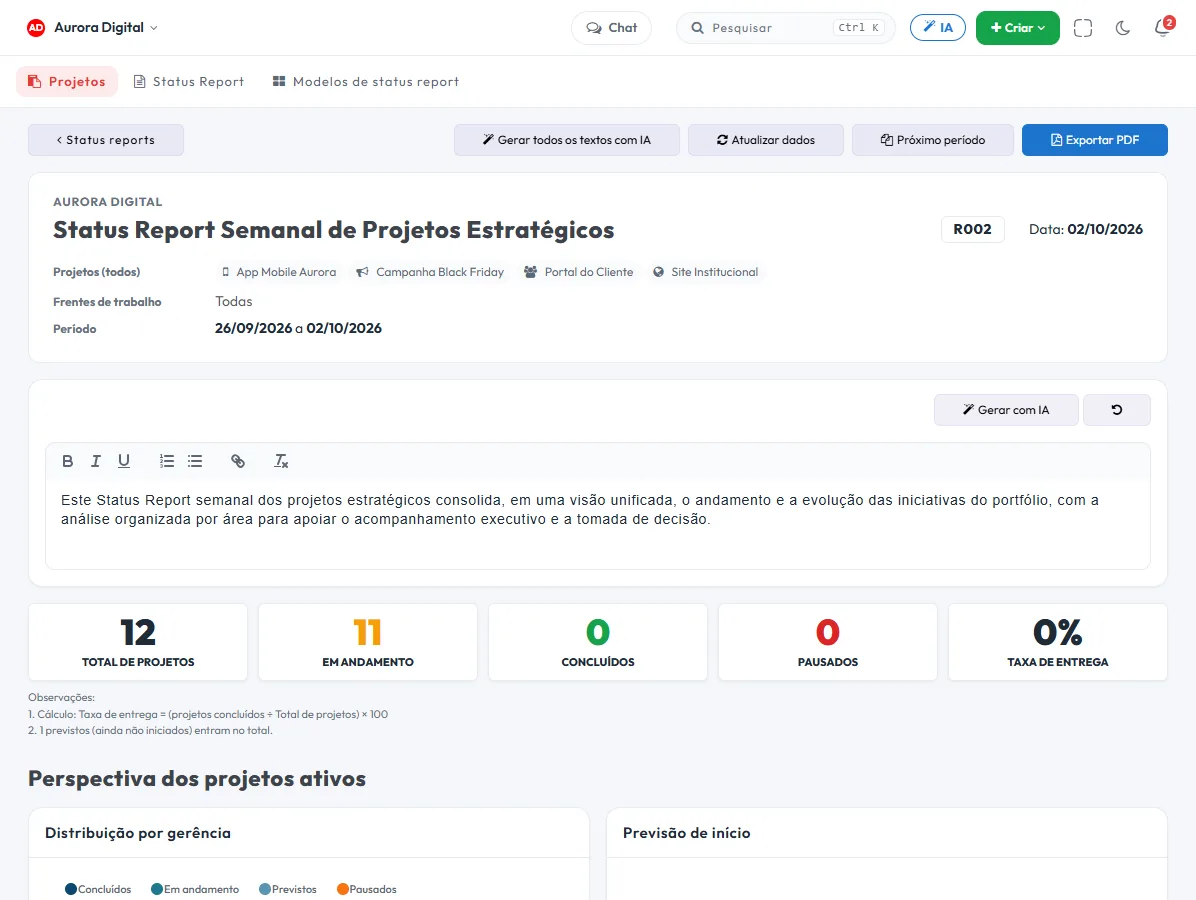
The report that builds itself, and stays yours
The boring part of a status report is gathering the numbers. The part that matters is saying what they mean. Tasskee does the first, the AI drafts the second and the decision of what goes to the client stays with you.
Build-your-own template
Indicators and text sections on a grid, with the order and width of each block, like customizing a dashboard. Each text section has a fixed title and an instruction for what is expected in it.
A snapshot of the moment
When you create it, that day's numbers are frozen. Opening the report the following week shows what was sent, not today's numbers. To refresh, there is a button.
Text written by the AI
The AI writes each section from the saved data and the template's instruction, and compares it with the previous edit to say what changed. No made-up numbers.
PDF ready to send
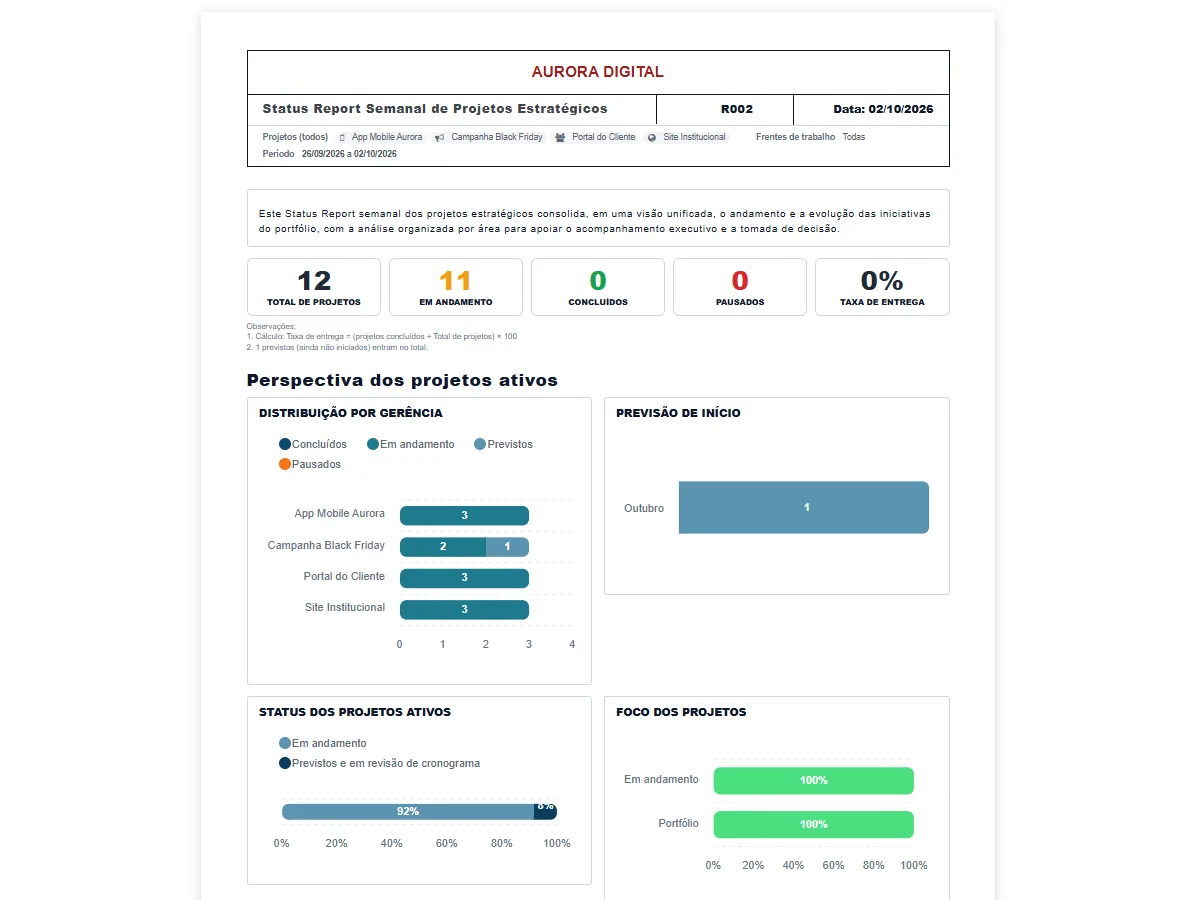
A4 page with header, edition and date, no scrolling and nothing from the system. Blocks don't split in half, and pages come out numbered.
Laid out for paper, not a screenshot
The PDF has its own layout, designed for the A4 page: indicators in a row, tables that fit, charts redrawn to the paper width and each title kept with its content.
- Header with the title, the numbered edition (R021) and the date
- Projects, workstreams and period of the scope, always in view
- Sections that start a new page, when the template asks for it
- The traceability note with the exact date and time of collection
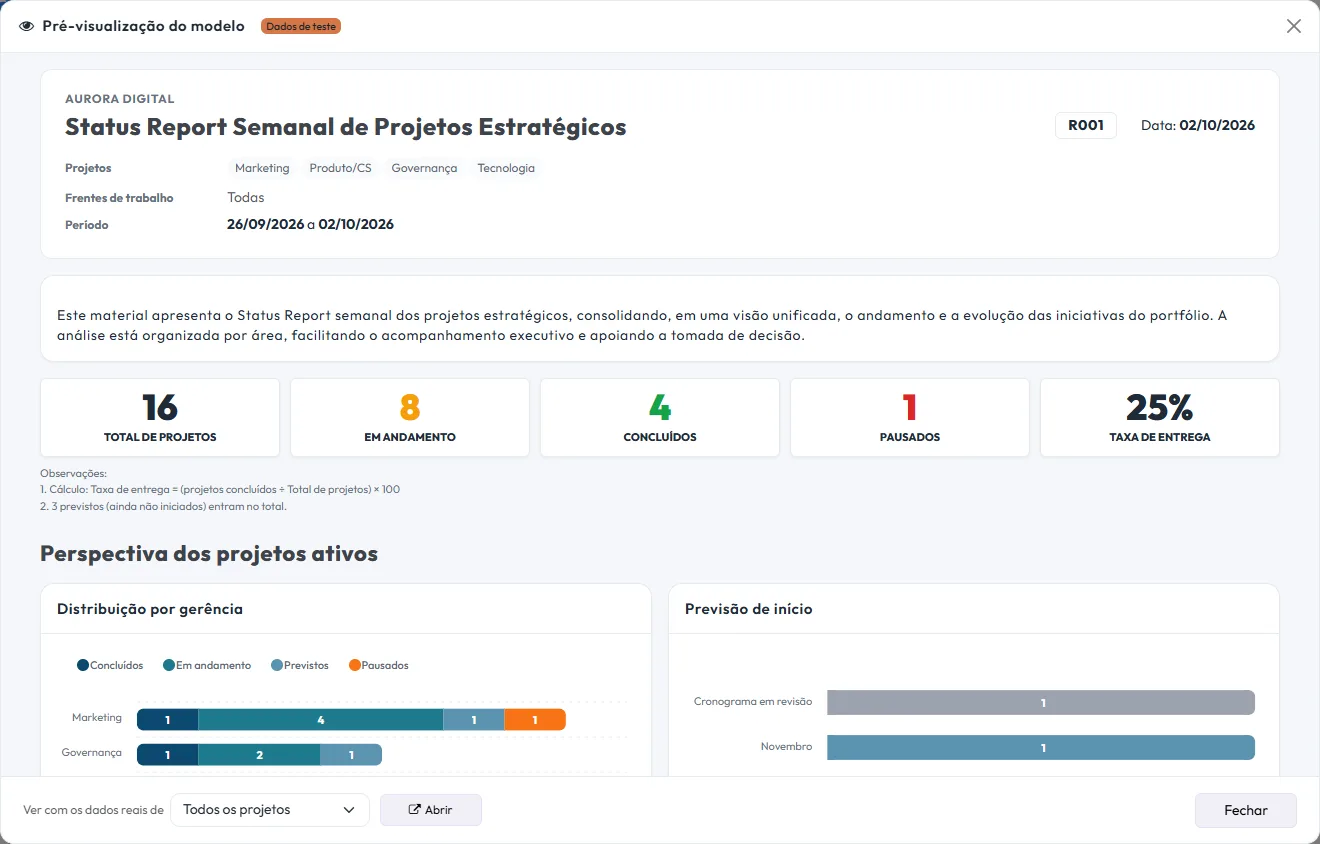
Build it once, see the result before saving
The template editor works like customizing a dashboard: the indicator catalog on one side, the grid on the other. The preview shows the report with sample data, the way it will come out.
- Portfolio and period indicators, and the same ones from the per-project dashboards
- Text sections with a fixed title, an instruction for the AI and starter text
- Section titles that can start a new page in the PDF
- The names your company uses: department, project, workstream, guideline
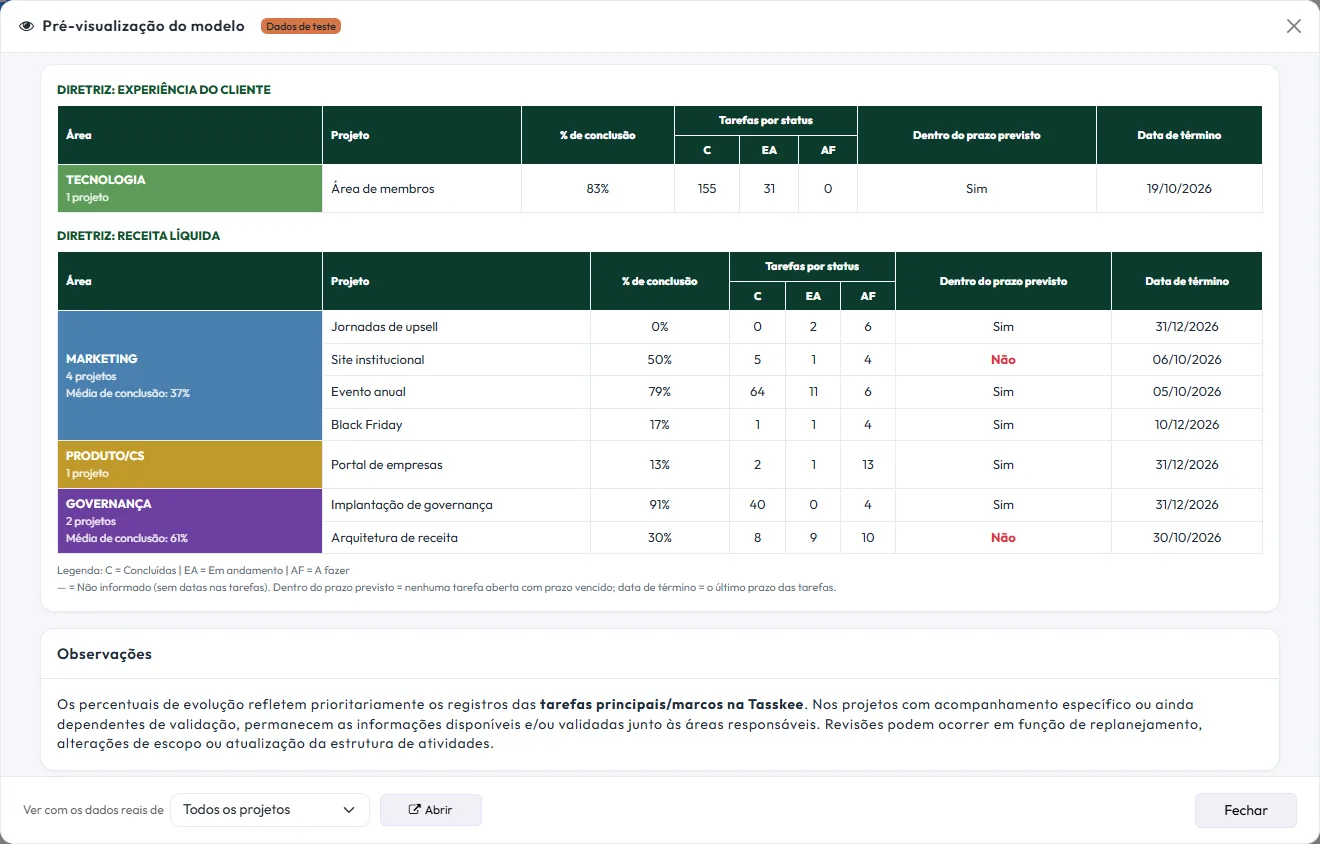
Each department with its initiatives, in a single table
In the portfolio template, the ongoing project is the department and each workstream is an initiative. The board groups by guideline and by department, with the percentage, tasks per stage and each one's deadline.
- Completion percentage and tasks completed, in progress and to do
- Within the expected deadline, with the end date taken from the tasks' last due date
- Average completion by department and portfolio delivery rate
- The week's milestones, with what each one depends on to happen
This lives alongside the rest of the operation
Task, schedule, ticket, goal, and conversation are the same database. What changes in one place shows up in the other, with nothing to export.
How to build a weekly status report the client reads to the end
The status report is the document that answers, every week, the same question from whoever is paying for the project: how are we doing? A good report fits in a two-minute read and makes clear what moved, what comes next, what might slip and what depends on a decision. The problem is that putting it together by hand eats the Friday of whoever manages: opening the dashboard, taking screenshots, pasting them into a presentation, counting tasks and writing the text from scratch.
In Tasskee the status report is a record, inside Projects. You pick a template, the projects and the period, and the report is born with that day's indicators. The text is written by the AI, from those same numbers, and you just review what goes to the client.
Step by step
- Choose or build the template. Start with a ready-made template, like the weekly status for strategic projects, or build your own: drag indicators and text sections onto the grid, choose the width of each block and write, in each section, the instruction for what's expected there. The preview shows the result with sample data before you save.
- Create the report. In Status Report, click New, choose the template, the projects (one, several or all), the workstreams if you want to narrow it down, and the period. Period shortcuts do "last week" or "last month" in one click.
- Let the AI write. When you create it, Tasskee asks whether the AI should already write the texts. With "Yes", each section is drafted from the frozen indicators and the template's instruction, comparing with the previous edition to say what changed.
- Review and edit. The texts are editable right in the report, with autosave and "undo" to go back to the previous version. The header with projects, workstreams and period doesn't change: it's the reference for the scope.
- Export the PDF. The PDF comes out in A4, with a layout made for paper, a header with the edition and date, and numbered pages.
- The following week, one click. "Next period" creates the next week's report with the same template and the same scope, and the edition numbering continues: R021, R022, R023.
A snapshot of the moment, and why that matters
The saved report isn't a live dashboard. At creation, each indicator has its numbers frozen, with the date and time of collection recorded in the document itself. Opening the report from three weeks ago shows exactly what was sent that week, not today's numbers, which have already changed. That's what lets you compare one edition with another and answer, months later, "what did we tell the client about that deadline?".
When you want the numbers as of now, the "Refresh data" button redoes the collection with the same scope and keeps the texts you've already written.
What usually goes in each part
| Part of the report | What it answers | Where it comes from in Tasskee |
|---|---|---|
| Portfolio indicators | How many projects, how many in progress, completed and paused, and the delivery rate | Each project's workstreams and the stage of their tasks |
| Projects in progress | Each one's percentage, tasks by stage and whether it's on schedule | Each workstream's tasks, with due date and status |
| Movements of the week | What changed since the previous edition | AI text, comparing with the previous report |
| Milestones of the week | What needs to happen in the coming days, and what it depends on | Tasks tagged as milestones and the dependencies between tasks |
| Risks, blockers and next steps | What might slip, what's already stuck and what will be done | AI text based on overdue, stalled and soon-to-be-due tasks |
| Alignment needs | Who leadership needs to talk to | AI text, reviewed by whoever sends it |
Download the free weekly status report template, with the five blocks and a filled-in example, and compare it with what Tasskee builds on its own.
Download the status report templateBest practices
- Same day, same format. Readers learn where to look. A fixed template and a numbered edition help the client read in less time each week.
- Write concrete instructions in the template. "List the risks, one per item, with the affected project" yields better text than "talk about the risks".
- Review before sending. The AI uses only the report's data, but you're the one who knows the client's context. The final text is yours.
- Keep tasks up to date during the week. The report reflects what's recorded. A task completed on Friday afternoon becomes a movement of the following week.
Common mistakes
- A report that's too long: if it needs an attachment, the body of the report isn't doing its job.
- Hiding the delay: a client who finds out at delivery loses trust. The report is the place to warn early, with the new date and the plan.
- Forgetting what depends on the client: pending decisions and materials are the part that speeds up the project the most.
Where the status report fits
Status Report is on the Pro plan, along with reports and dashboards. For clients to follow progress every day, without waiting for Friday, use the client portal. To generate the report through an AI agent, the assistant and the MCP server create the report, write the sections and refresh the data. Try Pro for 15 days, no card required, and send your next status report with the ready-made template.
Questions about the status report
What is a status report?
Do the numbers change if I open the report later?
Does the AI make things up in the text?
Can I have a report that covers several projects?
Do I have to build the template from scratch?
Can I generate it with ChatGPT or Claude?
Send the next status report in ten minutes
Create an account, try Pro for 15 days and generate your first report with the ready-made template.